1 Unit: 1: The World of Learner Data


Though learning analytics emerged as a new field of inquiry and practice fairly recently (2011), it is important to situate it in historical context — specifically, that educators have always collected, analysed and used learner data for a variety of purposes, such as planning, strategy, assessment, reporting and quality assurance.
Since the earliest recorded human activity, the evidence that individuals had learned something — for example, crafting utensils, finding their way to a destination or finding food — was provided once these tasks were successfully completed. One could not claim, for example, to be a (good) hunter if nothing was caught. The proof of learning has been found in evidence. (For an exploration of evidence and data-as- evidence, see Unit 2.)
In this unit, we situate learning analytics in a historical context of formal education where learner data have always been collected, where progress was measured and reported on, and where educational institutions have used these data for a variety of purposes.
Learning analytics is a continuation of this long history — collecting, measuring, analysing and using learner data to help learners and teachers understand learners’ learning and their progress.
Learning outcomes
After working through this unit, you should be able to:
- explain how education systems have always used learner data for a range of
- purposes, such as planning, operations, budgeting, pedagogical decisions and support
- map your institution’s collection and use of learner data — what data are collected and for what purposes, where the data are stored, who has access to the data and under what conditions
- create a case study of one of the courses you teach, and consider what data you use to make informed decisions on issues of pedagogical design, assessment and learner support

In the introduction to this unit, we pointed out that evidence or data have always been part of human learning. When education became formalised, various types of evidence began to inform how to arrange classes, how to plan for the next academic year, how to design curricula and outcomes, and, importantly, how to design assessment opportunities to evaluate whether learners have achieved the desired learning outcomes. Before the digital era, learners completed paper- based admission forms, and these forms provided school administrators and teachers with useful information about learners, such as their prior learning experiences, demographic details, and so forth. Learners were allocated to classes and to teachers who accompanied the allocated learners for the duration of the academic year. While the curriculum and the assessment strategies may have been predetermined (e.g., in the preceding academic year), teachers could adapt the curriculum and their pedagogical strategies based on observing learners — identifying which had trouble with some concepts, and which became bored waiting for others to catch up.
Observational data were, however, not usually enough to provide evidence of learning, so teachers designed formative assessments to determine learners’ progress. Marking these assessments served two important purposes, the first of which was to provide learners with feedback on their understanding and competencies in a specific area. These formative assessment opportunities also provided teachers with important information on where learners misunderstood concepts, which learners needed additional resources or extra attention, and which learners needed additional stimulation.
At the end of the academic period, teachers also had a responsibility to ensure that learners had sufficiently attained the intended outcomes to proceed to the next level. The level of attainment also served a dual purpose: as feedback to learners but also to the school administration to support them in placing learners at the right level for the following academic period.
Thinking in terms of the above historical background, we can see that data about learners has been part and parcel of education for a very long time. These data have served a number of purposes: planning, teaching, assessment and quality assurance.

 It does not matter to what extent you teach online or your institution’s processes are digitised; when we consider learners’ learning journeys over an academic term, these journeys share the following characteristics, illustrated in Figure “Overview of learners’ learning journey: an institutional perspective”:
- pre-registration enquiries from learners registering for the first time (or learners re-registering)
- (for some) application processes for admission, whereby learners are screened according to set criteria before they are allowed to register
- admission to the institution, followed by registration for a particular qualification or programme and possibly a selection of courses
- access to online course sites if the institution uses a learning management system, and/or learners attending face-to-face classes for the first time
- various points of enquiry, contact and engagement as learners progress — between peers, between learners and administration, and between learners and teachers
- formative assessment opportunities
- summative assessment
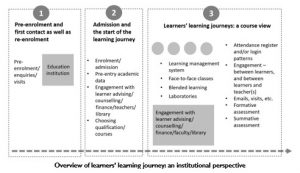
Figure “Overview of learners’ learning journey: an institutional perspective” provides a generalised view of how learners enrol at an educational institution, whether at the primary, secondary or post- secondary level. Although it is difficult to separate the different processes in a learners’ learning journey each academic year, the figure provides a lens on three different, but most probably overlapping, phases or stages: the pre-enrolment stage, admission, and the start of the learning journey itself. The third stage is a course view and provides an overview of what happens in every course a learner takes. While stage three may have different elements in your context, this stage of the learning journey will be shaped by the number of separate courses, the delivery mode (e.g., face-to-face, online, blended, laboratory work, etc.), and engagement with institutional staff not necessarily directly linked to teaching, such as study advisors or counsellors, the finance department and/or the library.
Following from this overview is a consideration of what types of learner data are shared and collected at every stage of the learning journey. Later in this course, we specifically address different types of learner data, but for now, we want to focus on what data are collected at an institutional level.
At this stage, we want to invite you to consider your own institutional process and think about what learner data are collected at each stage of the learning journey, as illustrated in Figure “Overview of learners’ learning journey: an institutional perspective”. You can use below given table to record what data you know or think your institution collects from learners throughout the three different learning-journey stages.
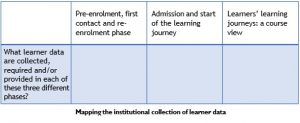
We suspect that though there may be some differences between contexts or institutions, if you have an opportunity to compare your table with those of other teachers, you may notice a number of similarities. What makes this activity interesting is considering whether the data that are being collected are stored as digital information, or on paper in some filing system, or whether some data (e.g., registration data) are digital, but your observations in the classroom or online spaces are located in paper-based reports. Formative assessments may be done on paper, with only the marks being recorded digitally (or not), and the assessments may not be digitised and stored on a central server. Does it matter? Or rather, why does it matter?

Let us first acknowledge that the format and scope of collecting, analysing, storing and using learner data are dependent on the context, the extent to which the institution’s systems are digitised, and to what extent teachers’ own processes of observation as well as formative and summative assessments are digitised.
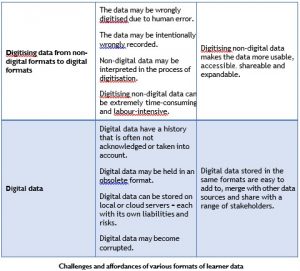
Though there are numerous challenges and risks involved in collecting, analysing, storing and using digital learner data, or digitising learner data (from paper to digital), the advantages of having data in a digital format tend to outweigh the challenges and risks. Below given table provides an overview of some of the challenges and affordances associated with digital, digitised and non-digital data.


This unit provided a broad, historical overview of how institutions and teachers have collected and used learners’ learning data for a variety of purposes, most importantly to evaluate whether learners are progressing (e.g., formative assessment) or have achieved the envisaged learning outcomes (e.g., summative assessment). The reality is that although many institutions have moved online with regard to admissions, registration and teaching, several still use a variety of non- digital and digital formats to capture essential learner data. Even where institutions’ processes (administrative and teaching) are totally online and available in digital formats, there are instances where data are recorded in non-digital formats. It is therefore important to think in terms of the whole range, from non-digital to digital data, and their associated challenges, risks and affordances.
We hope that you enjoyed this unit. In Unit 2, we explore the notions of evidence and data.

Congratulations on completing the first unit. Well done! Some of you may have found this overview almost too basic, while others may have had difficulty thinking about learner data from an institutional perspective. Whatever is the case, the following ten questions require you to choose only between “true” and “false,” and in some cases, it may be difficult to choose. Some of these questions go beyond the content covered so far and require you to think differently or more deeply than just finding the answer in the content above. The answers to these questions, along with further comments, are provided at the end of this unit.
a. Learning analytics is unconnected with how educational institutions have always collected and used learner data.
i. True
ii. False
b. Digitising non-digital data is an easy and fast process.
i. True
ii. False
c. There are no risks in storing digital data.
i. True
ii. False
d. Digital data are more trustworthy than non-digital data.
i. True
ii. False
e. Learner data collected for admissions and registrations have no impact on teachers’ pedagogical choices and assessment strategies.
i. True
ii. False
f. Having access to admission, registration and demographic learner data may assist teachers with teaching more effectively, appropriately and ethically.
i. True
ii. False
g. Digitising non-digital data is error free.
i. True
ii. False
h. If teachers have access to admission, registration and demographic learner data, they can misuse the data.
i. True
ii. False
i. Data collected by teachers in their classes (e.g., attendance patterns, login details, teacher observations, and formative and summative assessment results) should not become part of learners’ historical data files because of the dangers of misuse and labelling.
i. True
ii. False
j. If teachers have access to more learner data, they can teach and support learners more effectively.
i. True
ii. False
k. The last envisaged outcome for this unit involved you thinking about a particular course you teach. Consider the data you use to make informed decisions on issues of pedagogical design, assessment and learner support. What data do you have access to that you can use more optimally to inform your teaching?
