6 Unit: 6: Learning Analytics: Methods & Working with Data
![]()
When we talk about learning analytics methods, these include a range of methodologies and techniques inherent in educational data mining and statistical analysis — from basic descriptive statistics to structural equation modelling, the use of machine learning and, increasingly, artificial intelligence.
The definition of learning analytics carries three key parts, which constitute methods:
i. collection,
ii. analysis and
iii. reporting.
In this unit, we will discuss each of these parts, and introduce you to techniques, methods and tools that will help start your practical learning-analytics journey.
Learning outcomes
The course of this unit will follow the route one might take when exploring an educational data problem and conducting analysis in that context. After you have worked through this unit, you should be able to:
- identify the different analytical and statistical methods that are most often used in learning analytics, including but not limited to text analysis and process mining
- describe the uses of machine learning and artificial intelligence in learning analytics
- choose a context-appropriate option to make the optimum use of algorithmic decision-making systems (and understand the implications)

One key task in learning analytics is to know what data to collect, as well as where and how to collect data. Learning analytics involves qualitative and quantitative data collection methods. In this part of Unit 6, we focus on collection methods for quantitative data. (You will recall from Unit 2 that qualitative data collection includes structured and unstructured interviews, focus groups, observations, open-ended surveys and other narrative sources; if you need a refresher, you can review section “Making sense of knowledge claims”.)
The quantitative approach (an approach for numerical and/or measurable data) in learning analytics tends to give rise to large data sets. For example, when learners use digital learning environments, they generate lots of data that are stored on servers. This can lead to extremely large repositories of data sets, sometimes known as “big data.”

Data manipulation is critical when validating your quantitative sample. In the data science world, we say “no clean data, no clean mining results.” If the data source is a learning management system, a digital online platform or similar, it is highly likely that your hands will be dirty with rogue data. Data file extensions may be comma delimited, tab delimited, or pipe (|) delimited. As a learning analyst, you will almost certainly reach the stage where you work with a messy information structure. Log data from digital educational systems are most likely not immediately amenable to analysis (Slater et al., 2017). Hence, you must address your repository data types, values and rows.
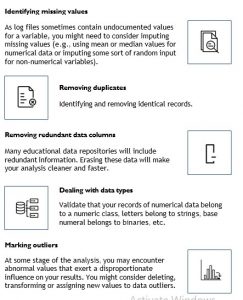
Data cleaning milestones
Noisy data are not intentional but incidental, arising due to technological and human flaws. In the following, we list some of the major cleaning steps needed when working with educational data for the purpose of implementing learning analytics techniques/processes:
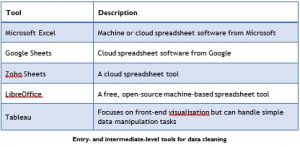
Entry and intermediate level
If you are new to data manipulation or have a little experience, below table presents our software recommendations for tasks of simple to medium complexity:
Advanced level
Spreadsheet software will not be sufficient for all types of data manipulation tasks. You may reach the point where there is a need to do advanced data aggregations, creating a more complex task not easily tackled by entry-level software. Such basic tools have limitations associated with the amount of data being pre-loaded, loaded, and executed, which slow down the analysis process. In given table, we suggest a few more advanced data-manipulation tools that you might use for both simple and complex tasks.

Having discussed data collection and manipulation for learning analytics, we now move on to discussing learning analytics techniques. There is a vast selection of popular methods and techniques for implementing learning analytics in order to understand, explain and solve educational applications and problems. Such techniques originate from the broader fields of machine learning, data mining, visualisations and statistics. Below, we provide a selection of some of the more popular techniques and methods for the analysis stage, taken from the literature (Leitner et al., 2017; Romero & Ventura, 2020).
Prediction
As noted in Unit 5, this is one of the most widely used techniques in the field of learning analytics. Prediction is used to forecast student performance, identify student behaviours, warn instructors and empower course designers.
Clustering
This is a key part of the science of data mining. Clustering brings together similar materials or learners based on their learning and interaction patterns. There are many examples of how to use clustering (Bharara et al., 2018), among them: to identify learning performance assessment rules; to provide personalised eLearning environments based on learner personality; to classify the eLearning behaviour of learners; to group learners on the basis of their cognitive flairs; and to recommend the best course combination for individual learners.
Outlier detection
This is used to indicate significantly dissimilar individuals/learners — for example, this may be used to detect learners with difficulties or unusual learning patterns. However, this method should be used with caution, as it can be associated with inadvertent labelling and other ethical consequences.
Relationship mining
Part of the data mining field, relationship mining aims to identify links between variables, but in a complex way. That is, it digs deeper to understand which variable is most closely linked to other variables.
An example of relationship mining in learning analytics is identifying relationships in learner behaviour patterns to diagnose student difficulties.
Social network analysis
This seeks to understand a community by mapping the relationships that connect the community’s individuals as a network, and then trying to draw out key individuals, groups within the network (“components”), and/or associations between individuals. Often abbreviated as SNA and used to examine collaborative learning environments by visualising relationships between learners, it can be powerful for identifying isolated learners.
Process mining
Also known as PM, this is a method to extract process‐related knowledge from a log of events. One of the most popular types of PM is sequential pattern mining, which seeks to find relationships between occurrences of sequential events, such as the individual tracing of multiple actions in grocery stores. Examples of process mining in education are exploring and visualising detailed traces, delivering a set of complex grade sequences, and examining students’ social interactions and timestamps of their behaviour over a long period of time.
Text mining
Text analysis is increasingly important in education. Several sources are available for exploring text learning patterns, including discussion forums, assignments, essays, chat, documents, and web pages. Text mining and analysis can be used to examine student support and motivation, recommend courses, conduct sentiment analysis, and generate automatic content and questions.
Distillation of data for human judgment
The main objective of this technique is to outline information in a visual way to aid decision making. In learning analytics, it has been used to help instructors to visualise and analyse the ongoing activities of learners and to provide information related to learning and course design.
Discovery with models
This is very much connected with prediction, clustering and other data mining methods. Some examples of how it can be used in education include identifying relationships among student behaviours and characteristics or contextual variables, and integrating psychometric modelling frameworks into machine-learning models. Discovery with models leverages the examination of conceptual frameworks that are brought into empirical work.
Gamification
This facilitates playful learning to maintain motivation — e.g., the integration of achievements, experience points or badges as indicators of success. Learning analytics can take advantage of gamification to enhance learning through the provision of more exciting representations of data and the use of incentives.
Multimodal analytics
Multimodal learning is concerned with multiple data sources, including the senses — visual, auditory and kinaesthetic. In learning analytics, it applies machine learning methods and sensor technologies (e.g., heartbeat, virtual reality, augmented reality. etc.) to present and explain new learning insights.
Machine learning (ML) and artificial intelligence (AI)
These are strongly related fields utilised to advance digital and smart education systems. ML methods with AI require advanced skills, such as using Naive Bayes, regression models and decision trees to provide effective advice, actions and perspective analytics. Some ML and AI practices seek to find insights in data automatically using intelligent models that are exposed to new data and adapt independently.
Descriptive statistics
This helps us understand the characteristics of data sets. You will no doubt be familiar with some types of descriptive statistics, such as the average (mean), mode and median. Other important ones are percentiles, percentages, count, and standard deviation.
Inferential statistics
This involves more powerful and complex methods than descriptive statistics. You might use inferential statistics when descriptive methods are limited. Inferential statistics allow you to make predictions (“inferences”) from data taken from samples by making generalisations about the population. Methods include t-test, regression analysis, analysis of variance (ANOVA), analysis of covariance (ANCOVA), and chi-square.
If you are interested in learning more about these techniques, follow the open education resource links in the footnotes.[22] [23]
[22] https://sgfin.github.io/learning-resources/#cheatsheets
[23] https://www.solaresearch.org/wp-content/uploads/2017/05/hla17.pdf

We now come to the final stage of learning analytics methods: reporting. The role of reporting is usually to give a summary to learners, instructors, researchers, course designers, decision makers or higher management. It is most often written (i.e., reports, best practices, fact sheets) or visual. Visualisations can be particularly useful; for example, learners can view their progress in assignments and classes, instructors can get an overview of their courses, and decision makers can be supported in making financial decisions.
Visualisation tools
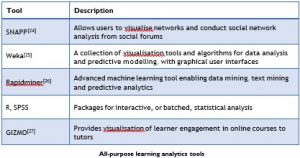
Visualisations in learning analytics effectively translate numbers into images. There are numerous approaches, such as charts, flowcharts, mind maps, 3D plots, scatterplots, pie charts and infographics. Recent research suggests that dashboards have become increasingly important, making outputs easy to understand, providing better visibility and offering informative insights. In below table, we list tools that can be used to generate either static or interactive visualisations of your data analysis.
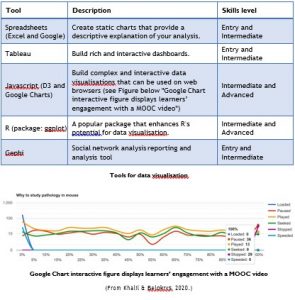

Many types of software are available for learning analytics, including off-the-shelf tools. In most instances, you will need to employ more than one tool — for example, dedicated software for creating dashboards. A selection of learning analytics tools is presented in Table in the next page.
[24] https://github.com/sandeepmjay/SNAPPSakai-Beta/blob/master/INSTALL.md
[25] https://www.cs.waikato.ac.nz/ml/weka/
[27] https://gizmo-vis.github.io/gizmo/notationEditor/index.html

We end this unit with the following key points:
- Learning analytics is a relatively young field, yet there are already several established approaches to gain insight and enhance the learning experience.
- The key stages in learning analytics methods are what, where and how to collect, analyse and report data.
- There are many different types and sources of data. You should aim to start your learning analytics exploration with data manipulation and cleaning.
- Analytic techniques are very much influenced by computer science methods; examples include machine learning and AI, data mining, and descriptive and inferential statistics.
- Learning analytics includes both quantitative and qualitative methods, but there is a greater focus on quantitative methods.
- A combination of tools and analytic approaches will enhance your uses of learning analytics more than a one-size-fits-all approach.
We hope you enjoyed this unit. In the next unit, we change tack and start to consider some of the ethical issues in the world of learning analytics.

a. Learning analytics includes quantitative and qualitative methods for doing data collection and analysis.
i. True
ii. False
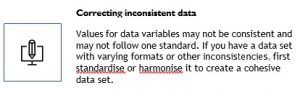
b. In learning analytics, it is compulsory to standardise your data types and values so that your data set is harmonised.
i. True
ii. False
c. Learning analytics includes techniques and methodologies in:
i. data analysis
ii. measurement
iii. data collection
iv. all of the above
d. Learning management systems and MOOCs are
i. eLearning platforms used by decision makers to develop insights on teachers
ii. learning platforms that are rich in educational data
iii. learning analytics quantitative methods
iv. techniques forming part of machine learning and artificial intelligence
e. Chi-square, ANOVA, and t-tests are methods used to collect data about learners.
i. True
ii. False
f. Spreadsheet programs are adequate tools for simple and complex data analytics tasks.
i. True
ii. False
g. Which of the following can be considered a visual reporting tool for learning analytics?
i. spreadsheets
ii. SPSS
iii. Google Charts
h. Removing duplicate records from educational data sets falls under:
i. data analysis
ii. data reporting
iii. data collection
iv. data manipulation
i. Machine learning and data mining sciences are methods of learning analytics.
i. True
ii. False
