3 Unit: 3: Understanding Academic, Learning and Teacher/Teaching Analytics

Welcome to Unit 3! In Unit 1, we discovered the world of learners’ data from the perspective of their enrolment at an institution — and how different data are collected at various stages of their learning journey. We started to explore how teachers can use available data to inform their pedagogies, assessment strategies and learner support. Using learner data is, however, fraught with potential risks and misinterpretation, as we discovered in Unit 2!
Unit 1 also made us aware that while teachers collect and use learner data for a variety of purposes, so does the institution. Although teachers have an interest in measuring learners’ progress and identifying those who may need support or extra stimulation, institutions collect and use learner data to plan, allocate resources and report to a range of stakeholders on a variety of issues, such as the quality of the offerings, trends in enrolment, student success, and so forth. This, in very simple terms, is the main difference between learning analytics and academic analytics. In addition, there is an emerging variation known as teacher or teaching analytics.
Learning outcomes
After you have worked through this unit, you should be able to:
- distinguish between learning analytics, academic analytics and teaching/teacher analytics
- define learning analytics and formulate a personal definition of learning analytics for your local context
- provide examples of the different types of analytics in your own course/institution
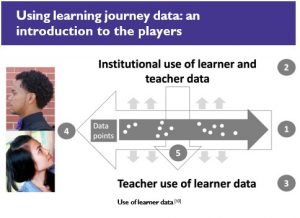
So far, we have focused on two main players in the use of learner data: the institution itself and teachers. We have seen how institutions collect and use learner data, and we now have a sense of how teachers collect and use learner and learning data. The illustration in Figure “Use of learner data” creates a visual representation of different aspects of the use of data in an educational context.
On the left, we have two students who have enrolled at the institution and started their learning journeys through the different phases discussed in Unit 1. First is admissions and (re)enrolment, registration and study.
[10] The two pictures of students were obtained from Pixabay, where they were published free for commercial use, no attribution required. Retrieved from https://pixabay.com/photos/side-profile- black-male-student-1440176/ and https://pixabay.com/en/girl-library-education-student-1721436/.
This journey is indicated with the arrow from left to right (1). As students progress through the different stages, they leave digital and non-digital traces and evidence of their learning journey (indicated by the dots in the arrow from left to right). These data points can then be collected by the institution (2) and teachers (3) for different uses (see section 3.3). The personal and behavioural data collected by the institution and teachers are analysed, and insights are shared with learners to help them make more informed and appropriate decisions (indicated by the arrow from right to left (4). We will discuss this aspect in section 3.3.
There is, however, another aspect that we might consider. Institutions have always monitored and evaluated the performance of teachers, and as education is increasingly moving online, institutions are beginning to use teaching and teacher data (the arrow pointing down, 5) to monitor and evaluate teacher performance.

In this section, we discuss further the three broad categories of analytics: learning, academic and teacher/teaching analytics. These three categories should not be confused with types of data (see Units 4 and 6 for discussions on sources and types of data). We also acknowledge that there are (increasingly) other forms of analytics for various aspects of teaching and learning that claim unique domains separate from these three forms — e.g., class and course analytics.
Central to academic, learning and teaching/teacher analytics are data. These data originate as learners are admitted to the institution, register, and start their learning journey, having chosen a particular programme and/or courses. Learners encounter the teachers allocated to these courses, who have the responsibility to teach, support and assess learners as they achieve the course learning objectives. The institution has, as its mandate and fiduciary duty, the responsibility to oversee and enable learners’ learning journeys, and also to hold teachers accountable for the execution of their duties.
Below given table provides an overview of the three types of analytics:
the data used, who uses them, and for what purposes.

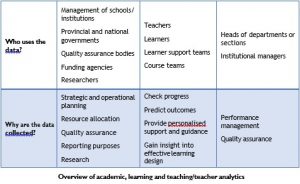
Academic analytics: Institutions do not tend to focus on the details of what is happening in classes, or what is happening at an individual level; they are largely concerned with the outcomes of the learning journey, that is, whether students pass, fail or drop out. Institutions might be expected to focus their data collection on learners’ final marks (allowing them to progress to the next level or to graduate), and on how a class or group of learners enrolling for the same course have performed. Institutions use these data, among other things, for reporting to provincial or national governments to justify funding, reporting on the quality of their programmes, marketing, as well as strategic and operational planning. National governments are also interested in researching trends in school-leaving examinations, compiling databases of data from different schools for national overviews, and assisting schools in measuring expected learner progress. For example, in the UK, the Fischer Family Trust [11] analyses cohort-wide learner outcomes annually, providing insights to schools for further focus and improvement.
[11] https://fft.org.uk/
Learning analytics: Learning analytics differs from academic analytics in being focused, unsurprisingly, on learners, particularly at the course level (e.g., Economics 101), and on the individuals in the course — what they need, how they are progressing and what can be done to better support them. While learning analytics may use some of the information collected by the institution (e.g., demographic data), learning analytics pulls in additional types and sources of data, such as class observations (face-to-face and/or online), formative assessments and summative assessments. The aim of learning analytics is not to report what happens in Economics 101 to national governments or regulatory bodies, but to teach more effectively and to support students more appropriately. It is also hoped that sharing the findings of learning analytics with learners may help them to make more informed choices.
Teacher/teaching analytics: Teacher or teaching analytics has links with learning analytics in the sense that both aim to ensure teaching and learning are as effective and as appropriate as possible. But whereas learning analytics has learners as a primary data source, teacher/teaching analytics focuses on what teachers do in the classroom, how they perform, etc. In some institutions, teacher/teaching analytics may be applied in service of the contractual agreement between the institution and teachers to ensure that teachers perform to expected standards.
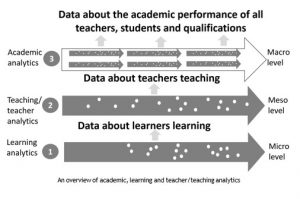
We might also think of the three types of analytics as occurring on three different levels, as represented in Figure “An overview of academic, learning and teacher/teaching analytics”. Learning analytics (arrow 1) functions at a micro-level, with each course having its own set of analytics to inform teaching and provide feedback to teachers and learners. The middle arrow (2) refers to teacher/teaching analytics, which provide the institution with feedback on how teachers are doing in terms of agreed standards. The top arrow (3) refers to academic analytics; you’ll notice immediately that this is actually a collection of arrows, each referring to the different courses and qualifications offered at the institution.
While learning analytics developed from a range of disciplines, such as education, psychology, computer science, mathematics, and data science, its central concern has always been about learning. The first Learning Analytics and Knowledge Conference (LAK’11) was held in Canada in 2011 and defined learning analytics as follows: “the measurement, collection, analysis and reporting of data about learners and their contexts, for purposes of understanding and optimising learning and the environments in which it occurs.” [12] Consider for a moment the illustration in figure “Visual representation of points of learning analytics” of a learning journey.
[12] https://tekri.athabascau.ca/analytics/
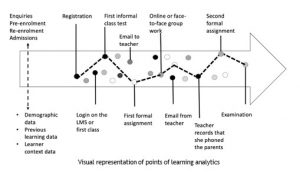
That original definition of learning analytics refers to four actions in relation to data: measurement, collection, analysis and reporting. Look at figure “Visual representation of points of learning analytics”, and consider the kinds of data collected from the first stage (as discussed in Unit 1) through to the examination. Data are collected at the pre- enrolment and registration stages — for example, previous learning records and demographic data regarding the learner’s context (e.g., home address, race, age, gender, etc.) — but also data that emerge as the learning starts, such as a first class or login on the institutional learning management system (LMS), forum posts, email communication to and from the teacher, informal class activities and observations, formative assessment (compulsory assignments), a note that the teacher phoned the parents, and marks from any summative assessment (e.g., examination).
The definition is clear that the data are collected “for purposes of understanding and optimising learning and the environments in which it occurs.” The data should therefore help us first to understand learning (more about that in Unit 5), and then to use this understanding to optimise learning and the environments in which the learning occurs.

In this activity, there are no right or wrong answers. We would like you to engage with the questions and formulate a position or a response.
a. Think about your own context where you teach (if you teach), and look again at Figure “Visual representation of points of learning analytics”. You may be in a context that is mostly face-to-face and may record these different interactions in non-digital formats, or you may be teaching a totally online course where you have access to a range of digital data (remember the different options in Unit 2?). Depending on your context, how would you define learning analytics?
b. This unit has focused on three types of analytics: academic, learning and teacher/teaching. Refresh your memory by looking again at Table “Overview of academic, learning and teaching/teacher analytics”. Thinking of your own institution, see whether you can discover information about these three types of analytics. For each category, find out what data are collected, who uses the data and why the data are collected (i.e., for what purpose).
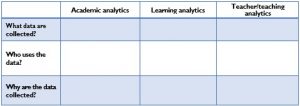

In this unit, we explored three distinct types of analytics: academic, learning and teacher/teaching. Table “Overview of academic, learning and teaching/teacher analytics” provided a brief overview of these three types and illustrated how they each collect and use different types of data, for different purposes and different audiences. Though teachers may be interested to know broader institutional statistics, they tend to have a greater interest in analytics insight that could help them to teach more effectively and to support learners more appropriately. Just as teachers may have a class focus, the institution may not necessarily be interested in how learners engage in a single class, or download resources from the LMS, and so forth (unless that class has unique characteristics that make it of particular interest). One might say that learning analytics focuses on the micro-context of learner performance, while academic analytics focuses on the macro or institutional level.
So, what about teacher/teaching analytics? It helps to think of this as being at the meso level, in between the institutional level of academic analytics and the micro level of learning analytics.

a. Learning analytics provides useful insight for provincial and/or national governments.
i. True
ii. False
b. Teacher/teaching analytics is used primarily to inform performance evaluations of teachers.
i. True
ii. False
c. Both academic and learning analytics make use of student demographic and context data, albeit for different purposes.
i. True
ii. False
d. Which of the following is not a characteristic of learning analytics?
(Choose all that apply.)
i. Aims to optimise learning
ii. Wants to understand learning
iii. Is primarily used by provincial and/or national governments
iv. Is used by funding agencies
