4 Unit: 4: Sources of Data: Mapping the Data Journey of Learners

Many things have changed since humans hunted for their food, or navigated without maps or GPS! While the Internet has clearly become deeply embedded in how we live, and how we make decisions, connect to others, learn and teach, we know that not everyone is equally connected. In some parts of the world, Internet connectivity may be problematic, whether due to a lack of network coverage, a lack of available devices and/or hardware, the affordability of data, or broader issues in communities, such as gender inequality, or power dynamics. The World Bank[13] published a report in 2016 showing that the affordances of the Internet are not equally spread. If you are curious about how connected the world really is, and how connected your own country is, visit this SlideShare presentation from Data Reportal here.
In Unit 4, we aim to map learners’ data in terms of their engagement with the institution — from their first point of contact or inquiry, to registration, and eventual completion. This will provide us with an overview of the data we have, where it resides, who has access to it, under what conditions and for what purposes.
Learning outcomes
After you have worked through this unit, you should be able to:
- map the learner journey in your respective course contexts
- identify what data are captured, by whom, in what form (digital or paper-based) and for what purposes, where the data are stored, who has access to them and how the data are used at each point in the learner journey
- categorise data sources as directed, automated, gifted or contractual
[13] World Bank. (2016). Digital dividends. International Bank for Reconstruction and Development & World Bank. Retrieved from https://www.worldbank.org/en/publication/wdr2016.
![]()
Nowadays, there is a huge amount of data on the servers of our institutions. Whether big data or small, they are valuable and important. You may have come across the term digital exhaust, meaning the data gathered from Internet use or other digital activities. These comprise the fuel that enables learning analytics to function. Without data, it is impossible to understand learners’ behaviour, evaluate systems, or assess courses within digital systems.
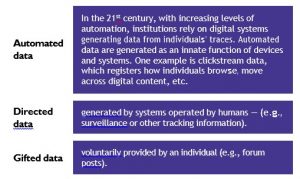
Learners are key for producing data in educational digital systems. Sources of learner data (see Figure “Four categories of data sources”) can be broadly categorised as one of the following (Kitchin, 2013):
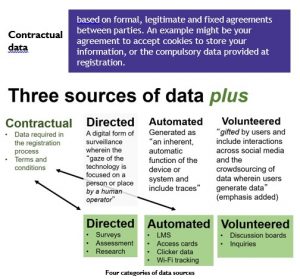 The inclusion of such a broad range of data sources has resulted in vast volumes of data being available like never before!

So what types of data can be collected or mined in learning analytics? Several studies have attempted to answer this question. Below given table provides an informative overview of data types in the field of learning analytics (Khalil & Ebner, 2015; Lin et al., 2019).
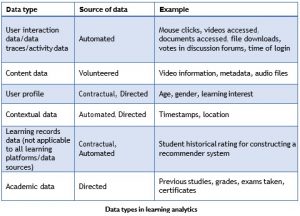
A key characteristic to keep in mind when working with learning analytics is to always remember that it is about learning and optimising the learning experience of learners, regardless of what data types and data categories you acquire!
![]()
It can be remarkably difficult to compare a measure developed in one context against those developed in another. Education systems vary considerably across the world, and this can make it hard to draw meaningful comparisons. In response, UNESCO initiated a framework [14] for organising education programmes and qualifications by applying uniform and agreed definitions to facilitate comparisons of education systems across countries.
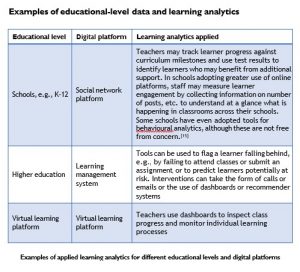
As well as this, the increasing but mixed use of online platforms leads to huge differences in data captured for learning analytics. Educational data sets can vary in size, degree, level and complexity. Currently, learning analytics has most often been applied to:
- school contexts (e.g., K-12), including early childhood education (nursery/kindergartens), primary, lower secondary and upper secondary education
- further/higher education, including colleges, undergraduate degrees, masters, and PhDs
- vocational education and training, including preparing learners for the world of work
[15] See Clarity Innovations. (2015). From analytics to adaptive learning: An overview of K-12 business models and opportunities, page 24. https://www.k12blueprint.com/sites/default/files/AnalyticsWhitePaper-FINAL.pdf.
![]()
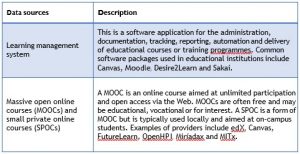
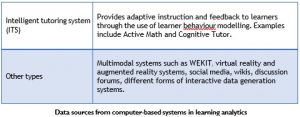
There is a plethora of data sources for learning analytics. With the ubiquitous spread of technology across education, including growing uses of artificial intelligence and machine learning, there is a potentially vast collection of data available for analysis. Computer-based systems are a positive goldmine of learner data. For example, even simply logging timestamps of login frequencies or tracking the coordinates of mouse movements can produce a massive amount of data for an average class.
Since this chapter highlights learners at a range of different educational levels, we have tried to provide a list of the most common educational computer-based systems where data are generated. Learning analytics data may be mined from many learning systems, including those listed in below given table.

Getting a better understanding of timing, places and activities in relation to learners is paramount when the objective of the technology use is to offer a better learning experience. In this part of Unit 4, we provide a short case study of a learner’s data journey.
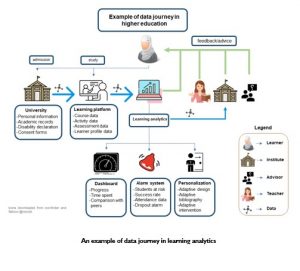
It can be helpful to use visualisation techniques to map learner data journeys (Howard, 2014). Let us imagine this represents the journey of one learner at a university who makes good use of online data. At the point of admission, lots of data are collected — some to provide sufficient information for the institution to complete registration in a programme and/or course, some to establish future study plans, some relating to the payment of fees, other information to allow the university to provide administrative support or additional other support if needed (such as if someone discloses a disability). These data would largely be contractual; some might be automated (fed in from existing study history held by the university), and some might also be volunteered by the learner. Some of these data will be attached to the learner’s profile so that advisors and administrators can easily access it as needed. Once study begins, the learner starts to generate activity traces (websites visited, forum posts, etc.) which are mined by the system. Most of these data will be filtered in some way and stored on the university servers or perhaps fed back to the learning system. As Figure “An example of data journey in learning analytics” shows, information collected as part of admission, from trace data and a growing assessment record, is sent into a learning analytics system.
The example shows three ways in which learner data are used (there could also be others). The first, shown here in the form of a dashboard, is a means of sharing with the learner their progress. The second approach shows an alarm system that could notify the learner, or her academic advisor or teacher, to intervene. Such a system might be triggered by a missing assignment, a lack of online engagement, or predictive analytics. The third component suggests how the system might be adapted to fit the needs and preferences of the learner. The institution, teacher or advisor provides feedback to the learner, the system or the learning process for enhancements.
For more insight into the data journey, watch this short video.
Watch Video: https://youtu.be/LdkRch9yn24
Video Attribution: Mapping the Data Journey in Learning Analytics by Commonwealth of Learning is available under CC BY-SA 4.0.

We end this unit with the following key points:
- Data in education are valuable, precious and necessary commodities for learning analytics.
- Educational data vary in type, value and classification. Learners may give their data by self-reporting or through computer-based automated systems. Other types include contextual and directed data.
- Sources of data in the educational context have grown with the application of computer-based systems, artificial intelligence and machine learning.
- Institutions harvest data that exceed our knowledge. It is questionable whether all these data are used to optimise the learning experience of learners.
- Mapping the learner data journey requires exploration and careful thinking. You should identify the users (stakeholders), define the goals, draw and design, and finally refine and iterate.
We hope you enjoyed this lesson. In Unit 5, we explore uses of learning analytics.

a. One learner starts a discussion in a group of learners using the popular messenger service WhatsApp. The data the learner generates is an example of automated data.
i. True
ii. False
b. A primary school course that includes seven video lectures is an example of activity data.
i. True
ii. False
c. Samia is a student at a primary school. Her parents provided the school with her full name, gender and date of birth to complete the registration process. The provided data by Samia’s parents are.
i. gifted data
ii. volunteered data
iii. automated data
iv. contractual data
d. Artificial intelligence and machine learning have introduced new types of data.
i. True
ii. False
e. Mining learner mouse clicks is an example of
i. contextual data
ii. consent data
iii. log data
iv. academic data
f. Some learner data are mined without linkage to learning optimisation.
i. True
ii. False
g. Digital exhausts can be considered
i. data sources for computer-based educational platforms
ii. feedback information to higher education
iii. sources for mapping data journey in education
iv. all of the above
h. Researchers, governments and decision makers are learning analytics stakeholders.
i. True
ii. False
i. Mobile platforms and wikis can be identified as learning sources for learning analytics.
i. True
ii. False
j. When mapping the data journey of a course you created, you may consider
i. stakeholders
ii. data types
iii. data sources
iv. all of the above
