2 Unit: 2: Understanding Evidence and Data

![]()
In Unit 1, we explored an institutional perspective on learner data, from pre-admission inquiries for first-time registrations or re-enrolments, to the registration process and the start of the learning journey. We also considered the formats that learner data are collected in — digital or non-digital — and their implications for making sense of learners’ learning. Having an institutional perspective on the collection, storage, analysis and use of learner data is a much bigger topic than has been addressed in Unit 1, and as we proceed, you will find different aspects of this institutional view on learner data in all of the units.
In this unit, we situate the collection, analysis and use of learner data against the backdrop of our assumptions and beliefs about evidence and data. Evidence and data have become increasingly important in developing policy, in helping us respond to pandemics or other crises, and in steering strategic and operational planning for educational contexts. So we cannot make sense of learning analytics if we do not also understand the paradigm and practices of evidence-based management, and the limitations, use and role of evidence. We also need to acknowledge some core assumptions about data — e.g., data as “raw,” “complete” and “objective.”
Learning outcomes
After you have worked through this unit, you should be able to:
- describe the basics of scientific evidence and the claims made in the name of research, as well as the criteria for valid claims
- critically engage with some of the general claims made about data and evidence, and understand the (mis)use of evidence in the public domain
- differentiate between causality and correlation
- define evidence-based management (EBM) in education and be able to name the limitations and dangers of EBM in education (e.g., randomised control trials)

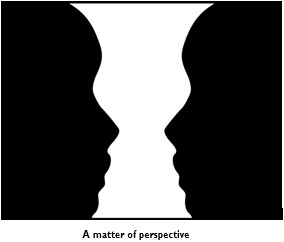
The image in Figure “A matter of perspective” is a very popular one for explaining the power of perspective. Do you see a wine cup or two faces?
Imagine seeing two faces but the person next to you seeing the wine cup. How would you convince them that there is no wine cup? Would it be possible for them to convince you that it is, in fact, a wine cup?
(Bryan Derksen, CC BY-SA 3.0, via Wikimedia Commons, https://upload.wikimedia.org/wikipedia/commons/7/74/ Cup_or_faces_paradox.svg)
By analogy, it is possible that you and your colleagues can look at the same piece of evidence but have two different opinions on what it means. While in this example, the difference in perspectives is relatively trivial, conflicting views on the same phenomenon can be much more serious. For example, think about public debates over whether immunisation causes autism, whether climate change is real, whether we can trace the history of humankind to evolution, or whether there is a life after death. In many of the debates surrounding these issues, each group will have their own set of evidence, shored up by science or their subscription to a set of beliefs (religious or otherwise). Making matters worse is the phenomenon of “fake news,” which often contains enough fragments of truth to lure the reader in, and is used by many to label a particular claim or belief as false, notwithstanding the validity of the evidence.
Welcome to the world of data and evidence — a world that may seem like a minefield at first. But don’t give up! In the rest of the unit, we will examine a number of guiding principles to help make sense of various claims and counterclaims.
 Thinking about the notion of “raw” data suggests that if data can be “raw,” then it can also be “cooked,” “cleaned,” “processed,” “sanitised,” etc. An example might be if you record an interview with a learner or a teacher, and on playing it back, you want to eliminate the background noise, the pauses, the interruptions and the times when your interviewee hesitated. You may also want to exclude from your report, views or statements that do not support your views or your claims. By the time you present your findings, they are based not only on what you found, but also on what you excluded.
The original recording of the interview is often referred to as “raw” data — meaning data that were found, data that have not been processed, cleaned and formatted. But was that data really “raw”? Imagine that you invited the colleague for an interview, she asked you what the interview was about, and you provided her with a broad outline of what you hoped to achieve. You may have selected her based on a number of criteria (e.g., you were looking for opinions of black females older than 40 who are employed in executive positions), but you also had in mind a number of set questions (whether open-ended or semi-structured) that would guide the conversation.
You may have allocated an hour for the interview and arranged for it to take place in a coffee shop. And then you conduct the interview, which you record on a portable voice-recorder. Afterward, you save it as an audio file. When you listen to the audio file, you use software to erase the background noise of the coffee shop, you erase the small talk about her rush to get to the interview in time, and you erase your apologies for being late for the interview because you were stuck in traffic. In transcribing the interview, you do not include her hesitations, her facial expressions or her body language.
Can we really speak about the initial data as “raw”? A number of decisions preceding the recording of the interview shaped the recorded data in ways that suggests they are not raw. Of all the possible candidates, you selected your interviewees based on some criteria, including availability. And what if, although you did not mention it explicitly, you did not consider the available candidates who were female, black, over 40 and in executive positions but were also living with physical disabilities, or were in established heteronormative relationships?
In such a scenario, can we really consider the recorded interview as “raw”? We don’t think so. We hold the position that the decisions that frame the research focus or question, the research methodology, the sample, and the exclusions and inclusions go on to shape the data in a number of ways, and that we cannot and should not talk about data as “raw.” If we also take into account the processing that followed the original recording — the reduction of background noise, the deletion of introductions and small talk, the deletion of hesitations, and the inability of the audio recording to capture facial expressions and body language, we are even more convinced that the final data set was anything but “raw.”
Consider the following example: You are curious about factors that influence learners’ chances of success. You decide that you will analyse learner participation data in an online discussion forum where participating is not compulsory. Secondly, you decide to look at participation in a selection of topics rather than all of the topics. To help you make sense of responses, you also define “participation” as posts containing at least ten sentences. Once you have selected the content based on the above criteria, you proceed with the analysis of the “raw” data. But again, you cannot speak of this data as genuinely “raw,” given the processes preceding the collection and how these influenced what data were collected and what were excluded.

There is a general belief that “numbers don’t lie” and that one can trust hard statistical evidence about a particular phenomenon more than, for example, perceptions or impressions. Let us consider the following: You are presented with two sets of evidence on the number of learners who have passed an online course. One set provides a table of the number of learners who attempted the examination and achieved a minimum of 50% (the qualifying pass mark). This table indicates that 65% of learners who attempted the examination passed with at least 50%. The other set of evidence contains interviews with one of the teachers and one of the markers. The teacher indicates that she has not seen the final data yet, but from her experience and from how learners were doing in the formative assessments, she thinks about 80% of learners will pass the examination. The marker indicates that he was allocated half of the submitted papers to examine, and from assessing that half, he estimates that the pass rate should be about 75%.
Which of the two sets of evidence would you trust? This is a fairly easy example — the one set of evidence comprises calculations of the number of learners who wrote the examination, their marks and a 50% cut-off point. The other set contains impressions and guesses. So when someone asks you how many learners passed the examination, you will most probably rely on the first data set.
But before you think this is simple, consider the possibility that the head of the department or your manager calls you in and asks you the same question, and when you provide her with the answer, she responds by saying, “I want to know what percentage of learners who enrolled for the course passed the exam.” Now, this is a different question. The first data set only considered learners who attempted the examination. It is well known that many learners in online courses drop out before the examination or do not attempt to write the examination. So if 100 learners registered for the course, but only 80 attempted the examination, then the total pass rate for the course looks different from the pass rate of those who sat for the examination. Though 65% of the 80 learners who sat for the examination passed, if one takes the initial number of learners into account (100), the pass rate is even lower: 52%.
The point we are trying to illustrate is that whilst numbers or statistics are regarded as more truthful, one should take care to look at how the inquiry was phrased!
General principles of scientific research are that the research should be valid, reliable and generalisable. Note that these three criteria do not apply in the same way to research based on qualitative data, such as interviews, open-ended surveys, and/or observations. However, let us start with the three criteria that apply to quantitative research (research using numbers, like the example above).
- Validity refers to whether the concept being measured is measured accurately. For example, if your manager asked you for the pass rate of the whole enrolment, but you provided her with the pass rate of those who sat for the exam, this would not be valid. In another example, if you want to measure how many people suffer from depression, but your questions actually measure anxiety, your research will not be valid.
- Reliability refers to the consistency with which another researcher will find the same results. For example, if another researcher reports on how many learners from the original enrolment passed the exam, she should find the same answer if she uses the same method of calculation.
- Generalisability refers to whether we can apply the research results of a particular calculation to other contexts, using the same method and finding the same results. For example, consider asking about the gender, race or age of those learners who sat the exam and passed, and then claiming that in all online examinations in your subject, a particular gender, race or age would always perform better than those of a different gender, race or age. Based on the example we have used so far, you would not be able to make that claim, so your findings would not be generalizable. However, if your calculations were based on a national online exam and you used data from the last ten years, the potential generalizability of the findings would be much better.
With regard to qualitative research (e.g., interviews, focus groups, observations), different criteria allow us to judge whether the findings are trustworthy. You will immediately notice that we use different terminology for qualitative research. As we illustrated, the use of numbers or statistics does not necessarily mean the findings are valid, reliable and generalisable. Conversely, findings that are not numerical or do not contain statistics are not necessarily untrustworthy. Below are four criteria to consider when evaluating the trustworthiness of qualitative findings.
- Credibility refers to activities that confirm your analysis is credible if another independent researcher confirms the analysis and findings based on a subset of your data. The data not analysed then serve as checks and balances to see whether the findings are still valid.
- Transferability refers to whether the findings can be used in another context. This is similar to the criterion of “generalisability” in quantitative research. In qualitative research, it is not the researcher who claims that her findings are transferable; instead, other researchers engaging with her findings and her detailed, “thick” analysis decide whether the findings also apply in their respective contexts.
- Dependability refers to how reliable the analysis is. Dependability can be ensured by using multiple methods, sources, theories and fellow researchers to investigate and analyse a phenomenon; this is also referred to as “triangulation.” Researchers can also ensure dependability by being transparent about their processes and documenting these so they can be audited if necessary.
- Confirmability links to dependability and can be enhanced by the researcher making field notes, recording observations and keeping a journal.
We realise that the above may be too much (or not enough) information if you have never thought of data and research in a more systematic way. If you are curious or want to know more, explore research methods here and here.

One of the major dangers in looking at student engagement patterns, for example, and then considering whether learners who participate more in online discussions also have a higher pass rate is that we will confuse causation and correlation.[2] Causation refers to a cause-and- effect relationship, such as a stone thrown in a pool of water causing the water to ripple outward. There is a direct link between throwing the stone into the water and the stone’s impact on the water causing ripples. It is important to note that causation implies there is no alternative explanation for why there are ripples in the water; they arise specifically because someone has thrown a stone into the water.
Correlation is when we see the ripples in the water, but we have not seen anyone throw a stone in the water; there are kids playing close by, but there are also fish coming to the surface, frogs who may have jumped into the water, and insects who may have landed on it. You cannot be sure which one of those caused the ripples in the water, but you can say there is a possible correlation between seeing ripples in the water and having one or more of those other circumstances occurring at the same time.
Let us now consider causation and correlation in teachers’ attempts to improve learners’ chances of success. One teacher may believe it is the extra classes he provides that are making the difference. Another teacher believes learners’ marks have improved since she started to use a particular technology in the classroom. Teachers often believe that whatever strategy they employed has caused the change. They frequently report on the effectiveness of particular strategies by indicating learners’ performance before the intervention, describing the intervention, and then presenting measurements of the learners’ performance after the intervention. If there is an improvement in learners’ performance, these teachers claim their strategy caused the improvement.
There is an established research methodology first used in scientific (specifically medical) research that has gained some popularity in education: randomised controlled trials. In medicine, researchers investigate the impact of one factor or variable on a selected organism or portion of an organism to study its effects. Important in such laboratory settings is that all other variables that could also influence the impact of the factor are excluded. Because the only thing that changed was the one factor or variable, researchers are then able to explain the changes that occurred as being direct results of the introduction of the one variable. They can then say, without a doubt, that the introduction of the one variable caused these changes. Even more important is that researchers can then claim that under exactly the same conditions, the introduction of the factor or variable will have exactly the same outcome. This is also referred to as the reproducibility of the results.
Think of a classroom situation where you randomly divide the class into two sections (meaning everyone has an equal chance of being in either section). You expose one group to an intervention, and the other group (known as the control group) continues as normal. Afterwards, you have all the learners do an activity, and you measure whether the group that was exposed to the intervention performs differently from the control group. Analysing the results, you then claim that the intervention caused one group to do better than the other group. Such an experiment would be a randomised controlled trial (RCT).
While such an experiment seems relatively easy (and harmless), a number of challenges may have an impact on the claims made during an RCT. For example, if the experiment of introducing a selected group of students to a particular technology takes place over a long period of time, it becomes impossible to exclude other factors or variables.
What if during these interventions, the school also starts offering free meals, renovates classrooms, or begins providing disadvantaged learners and their families with psychological and social support? While the teacher’s intervention may have had an impact, we cannot say for certain that the intervention caused the improvement in learners’ performance. There may be a correlation between this intervention and the improvement in results, but the intervention was not the only element in the school environment that changed during this period. The improved results could therefore be due to a combination of factors.

The preceding section is a wonderful introduction to considering education as an open and recursive system.[3] What do we mean by “open and recursive”?
There are many aspects within the control of teachers in a teaching and learning environment, e.g., pedagogical choices, assessment strategies, quality of assessment feedback to learners, and so forth. There are also many aspects in that environment controlled by administration and management, such as budget and resource allocations, planning, and so forth. It is fair to say, though, that there are many things outside the control of those directly linked to the institution — for example, economic conditions, crime in the areas surrounding schools, the employment status of parents and carers, and other factors. Education should therefore be considered an “open” system, as it is impossible to isolate a classroom from the rest of learners’ lives — their communities, the circumstances affecting parents, and so on. The term “recursive” refers to the ways in which those patterns of influence tend to repeat themselves.
[3] Biesta, G. J. (2010). Why “what works” still won’t work: From evidence-based education to value-based education. Studies in philosophy and education, 29(5), 491–503.
As we will explore in the next section, we often think of classrooms (whether physical classrooms, online, or hybrid) as laboratories where we can isolate learners from outside influences, change a single aspect of their learning, and observe the impact of that change. This belief that one can isolate learners and change one variable while not changing anything in another group of learners underlies the notion and practice of randomised control trials.
Though many things are within the control of teachers and learners, there is much that is not within their control. While it is understandable for teachers to claim that their interventions have made a difference, we should be careful not to confuse correlation with causation. If you are curious about how the confusion between correlation and causation can play out, here are some examples: there is a correlation between the consumption of margarine and divorce rates in Maine (France); [4] there is also a correlation between autism and living close to a freeway.[5] In the latter case, a newspaper headline presented this correlation as causation.[6] In a 2015 article, the Harvard Business Review [7] discusses the dangers of thinking that because there is a link between two phenomena, this means the one causes the other.
[4] https://www.datasciencecentral.com/profiles/blogs/spurious-correlations-15-examples
[5] https://www.latimes.com/archives/la-xpm-2010-dec-16-la-he-autism-20101217-story.html
[6] https://www.statisticshowto.com/spurious-correlation/
[7] Harvard Business Review. (2015, June). Beware of spurious correlations. Retrieved from
https://hbr.org/2015/06/beware-spurious-correlations

This may not be news to you, but the emphasis on using evidence to inform educational strategy and implementation is a global one. Governments, regulators, and management structures of educational institutions all look for “what works.” While it is understandable that we should be concerned whether the resources allocated to interventions, new laboratories and new staff make a difference and “work,” a number of authors, such as Biesta, [8, 9] argue that “what works” is not necessarily the right criterion. Rather, Biesta suggests that we should also consider whether the intervention or action is “appropriate.” An example of an action that “works” but that may not be appropriate would be to offer extra classes on the school premises to help increase the success rate, but only for those kids who can pay. While we all would agree that extra tuition would most probably “work” and raise learners’ performance, the prerequisite that learners must pay to attend extra classes, offered on the school premises by the very same teachers responsible for the classes during school time, is definitely not appropriate.
[8] Biesta, G. (2007). Why “what works” won’t work: Evidence‐based practice and the democratic deficit in educational research. Educational theory, 57(1), 1–22.
[9] Biesta, G. J. (2010). Why “what works” still won’t work: From evidence-based education to value- based education. Studies in philosophy and education, 29(5), 491–503.

We don’t doubt for one second that evidence plays a seminal role in making better, more effective and more appropriate decisions. But as we have pointed out in this unit, we need to critically engage with that evidence, whether it is based on quantitative or qualitative research.
Just because something is presented in numerical form or as a compelling narrative does not mean that the evidence is trustworthy.
Learning analytics is becoming increasingly central to looking for evidence around why some learners are more successful than others, or determining whether our interventions as teachers make a difference. This unit has laid the foundation to celebrate the huge potential of learning analytics to help us teach better, and help our learners to learn better, whilst recognising that we should also critically engage with claims made based on those analytics.
At the outset of this unit, we invite you to reflect on the following questions. It’s fine if you’re unsure or don’t know the answer. As you read the unit, you may recognise some of the issues raised in these questions. We also provide pointers and further explanations at the unit’s end.
a. Think back to the previous unit and how institutions collect learner data. We emphasised how formative and summative assessments are ways to ascertain whether learners are making progress and have achieved the envisaged learning outcomes. Consider the following statement: The marks learners receive in a summative assessment (e.g., a written examination) are a true reflection of whether learners have achieved the desired outcomes.
i. True
ii. False
b. There are many aspects of learners’ learning that we cannot capture, which means our “evidence” of their learning is always partial and tentative.
i. True
ii. False
c. We can consider data about learners’ performance to be neutral and a true and complete version of their performance.
i. True
ii. False
d. Evidence suggests that learners who study in their home language have a greater probability of passing their course than learners who study in a second or third language. The relationship between studying in your home language and passing a course is an example of causation, not correlation.
i. True
ii. False
e. In testing the effectiveness of an intervention to improve learner success, we can divide a class into two groups: one that will be exposed to the intervention, and one that will not (the control group). If the group receiving the intervention does better than the control group, this is proof that the intervention will work for all learners in that disciplinary and institutional context.
i. True
ii. False
f. Having interviews with learners and their parents about the effectiveness of a particular technology in teaching and learning is an example of quantitative research.
i. True
ii. False
g. Instead of conducting interviews with learners and their parents, you circulate a survey on the impact of technology on teaching and learning. Your questions ask respondents to use a number (1, 2, 3, 4 or 5) to indicate how important they think a particular aspect is, or to what extent they agree with a statement, where 1 indicates they do not agree at all, 2 they disagree somewhat, 3 they do not really have an opinion, 4 they agree somewhat and 5 they agree completely). You will calculate the responses and will be able to report on how many of your respondents indicated that they agreed, agreed somewhat, did not have an opinion, disagreed somewhat or disagreed completely. This is an example of quantitative research.
i. True
ii. False
h. The notion of “transferability” in qualitative research means your findings from the interview with parents and learners can be applied to another context.
i. True
ii. False
i. How will you determine whether people find your quantitative analysis of the survey on the impact of technology on teaching and learning reliable? (Choose one.).
i. if my headmaster or head of department confirms that they agree with the findings
ii. when the findings are used in another context
iii. by ensuring that if another researcher uses exactly the same questionnaire and the same methods in another context, they will find the same results
j. A reporter visits your institution to investigate the work conditions of teachers, and she only speaks to the principal or head of the institution. She then reports her findings and claims that teachers are very satisfied with the working conditions, not mentioning she only interviewed the principal or head of the institution. What is wrong with such a report?
i. The reporter should also have spoken to the kitchen and maintenance staff.
ii. Choosing an interview as a data collection tool was not appropriate; she should have sent a quantitative survey to the headmaster to get her responses in writing.
iii. She should have at least indicated in her report that she only spoke to the principal, or she should also have interviewed teachers.
If you found these questions difficult, welcome on board! When we get to the end of this unit and revisit the questions, you may be in a better position to consider your initial responses and, possibly, change your answers.
